The Music Tweet Map is a visualization and exploration tool for
music listening behaviour published via Microblogs (Twitter, in this case).
It allows to display geographic positions of such Tweets
(short messages on the Twitter platform, limited to 140 characters) on
a browsable map, applying various filters and aggregation functions.
Music Tweet Map hence gives an idea about regional differences in music taste,
and helps identify potentially interesting artists.
Due to their continuously growing importance and usage, social media
provide a valuable source of user-generated and user-related information.
Especially microblogs - due to their nature of being less conversational
and providing means to share activities, opinions, experience, and
information - are well-suited for discovering breaking news and for
user-centric information retrieval.
Since its advent in 2006, Twitter's popularity has been continuously
growing, resulting in being today's most popular microblogging service.
One of the many types of information posted via tweets is information on
the music a user is currently listening to. This information may be
provided either manually (e.g. included in personal comments) or
automatically by plugins for music players or music portals.
Music Tweet Map uses this information and the geospatial coordinates of
the messages to visualize song and artist information on a world map.
This should provide a visual impression on geographic music listening
patterns.
Using
Twitter's Streaming API, tweets containing potentially music-related
hashtags (for instance: #nowplaying, #NP, #itunes, #airing,...) are
crawled and analyzed for song and artist information. If matches with
the musicbrainz-database are found, the respective tweet is
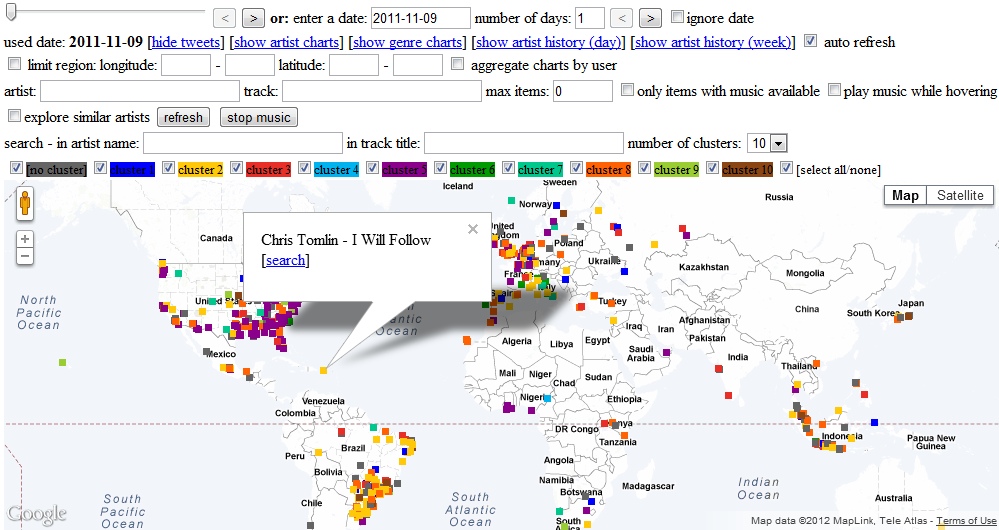
visualized as a small square on the world map, using it's geospatial
information for positioning. Hovering such a square with the mouse opens
a more detailed information window including artist name and track title.
If there is a short mp3 snippet available, it is also possible to play this
part of the track.
In order to give a visual impression on the type of song that is represented
by this tweet, artists are clustered by their last.fm genre tags
(i.e. last.fm tags that are included in a list of 1,944 known genres
provided by freebase). Depending on the number of clusters, the clusters of
artists/genres become more or less homogenous. Users may choose a number
of 10 to 20 separate clusters, each cluster being assigned a specific colour
in the visualization.
For ten different clusters, the top 20 assigned genre tags are:
- Electronic, House, Electronica, Dance, Techno, Electro, Trance,
Down-tempo, Synthpop, Minimal techno, Progressive House, Deep house,
Tech house, Drum and bass, Breakbeat, Electropop, Dub, Dubstep, Electro
house, Electroclash
- Rock, Alternative, Alternative rock, Hard rock, Progressive rock,
Classic rock, Heavy metal, Psychedelic rock, Grunge, Garage rock,
Christian, Alternative metal, Progressive, Stoner rock, Nu metal,
Christian rock, Post-grunge, Rock and roll, Southern rock, Modern rock
- Indie, Indie rock, Indie pop, Post-punk, Lo-fi, Emo, Britpop,
Dream pop, Math rock, Power pop, Indietronica, Indiepop, Noise pop,
Chamber Pop, Piano rock, Twee pop, Dance-punk, Neo-Psychedelia,
Hamburger Schule, Jangle pop
- Experimental, Ambient, Noise, Psychedelic, Dark ambient, Drone,
IDM, Industrial, Post-rock, Avant-garde, Instrumental, Glitch, New Age,
Noise rock, Contemporary classical, Breakcore, Space rock,
Electroacoustic, Darkwave, Krautrock
- Hip-Hop, Rap, hip hop, Underground hip hop, Underground, Gangsta
rap, Reggae, Dirty South, Turntablism, Southern rap, Grime, Dancehall,
G-funk, Horrorcore, Crunk, Ragga, Reggaeton, Memphis rap, Chicano rap,
Experimental hip hop
- punk, Punk rock, Pop punk, Ska, Street punk, Ska punk, Garage
punk, Garage, Anarcho-punk, Skate punk, Folk punk, Streetpunk,
Psychobilly, Skacore, Horror punk, Riot Grrrl, Melodic, Celtic punk,
Deathrock, Christian punk
- Folk, Singer-songwriter, Acoustic, Celtic, Folk rock, Country,
Americana, World, Irish, Indie folk, Traditional, Bluegrass, Neofolk,
Medieval, Ethnic, Freak folk, New Weird America, Trad, Folkmetal,
Acoustic rock
- Pop, Rnb, Pop rock, New Wave, J-pop, Disco, Eurodance, Soft rock,
Turkish, Anime, Latin pop, K-pop, Europop, Ballad, Russian pop, Turkish
pop, C-pop, Asian, Gospel, Teen pop
- Jazz, Funk, Soul, Fusion, Blues, Lounge, Piano, Acid jazz, Free
jazz, Swing, Smooth jazz, Nu jazz, Jazz fusion, Soundtrack,
Contemporary Jazz, Easy listening, Vocal jazz, Bossa nova, Classical,
Big band
- Hardcore, Metalcore, Metal, Hardcore punk, Death metal,
Post-hard-core, Thrash metal, Screamo, Gabber, Black metal, Grindcore,
Melodic hardcore, Straight edge, Deathcore, Melodic death metal,
Progressive metal, Hardcore techno, Mathcore, Thrashcore, Power metal
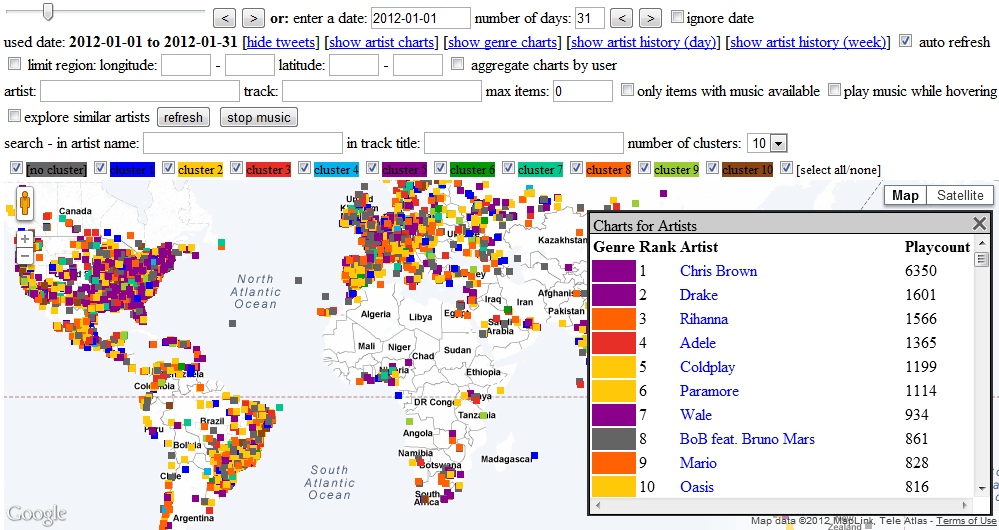
In order to
get statistical information and to detect global trends like
globally popular artists, it is possible to display the artist charts for the
selected period of time.
Moreover, it is possible to restrict the charts applying various filters, i.e.
in order to get the charts for a specific genre cluster.
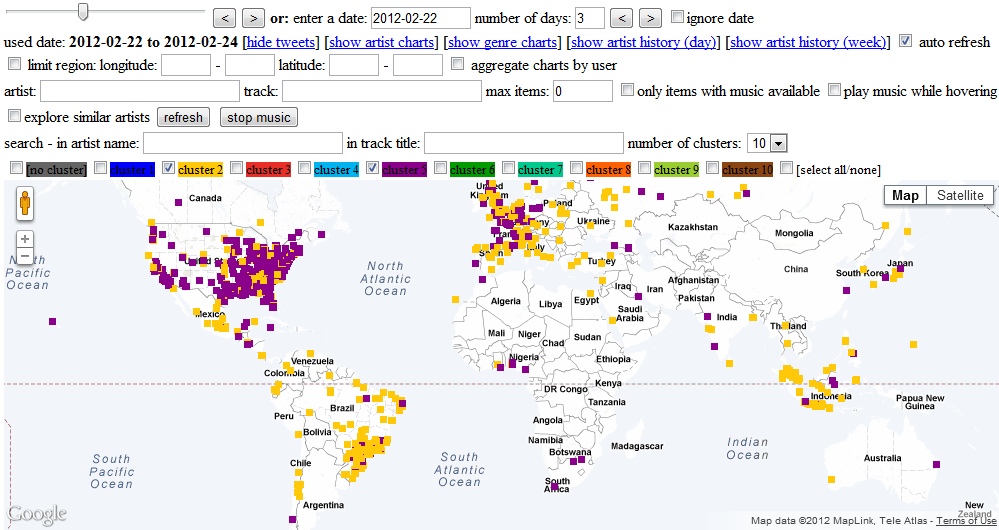
This restriction to genre clusters might also help to identify local
trends. For instance, when comparing the United States with South America, we see
that the cluster consisting of Hip-Hop, Rap, etc. is relatively
wide-spread in the United States (cluster 5 in this example), whereas South America shows
a strong preference for the Rock cluster (cluster 2 in our examples).
The Music Tweet Map allows to (de-)select single clusters, comparing them
directly to each other. Displaying genre distribution charts reveals
actual
numbers. In this example, cluster 2 is indeed three times as popular as
cluster 5 in South America, but cluster 5 is 5.6 times as popular
as cluster 2 in the United States of America. This pattern remains
consistent for the whole period of observation.
Further investigation reveals that also France shows a relatively high
occurrence of Hip-Hop/Rap, whereas Spain and Italy
(like South America) have a much stronger Rock cluster.
Music Tweet Map also allows to evaluate a single artist's popularity.
For instance, it is possible to restrict the visualization to a single
artist and to present the geographic spread of the artist's listeners.
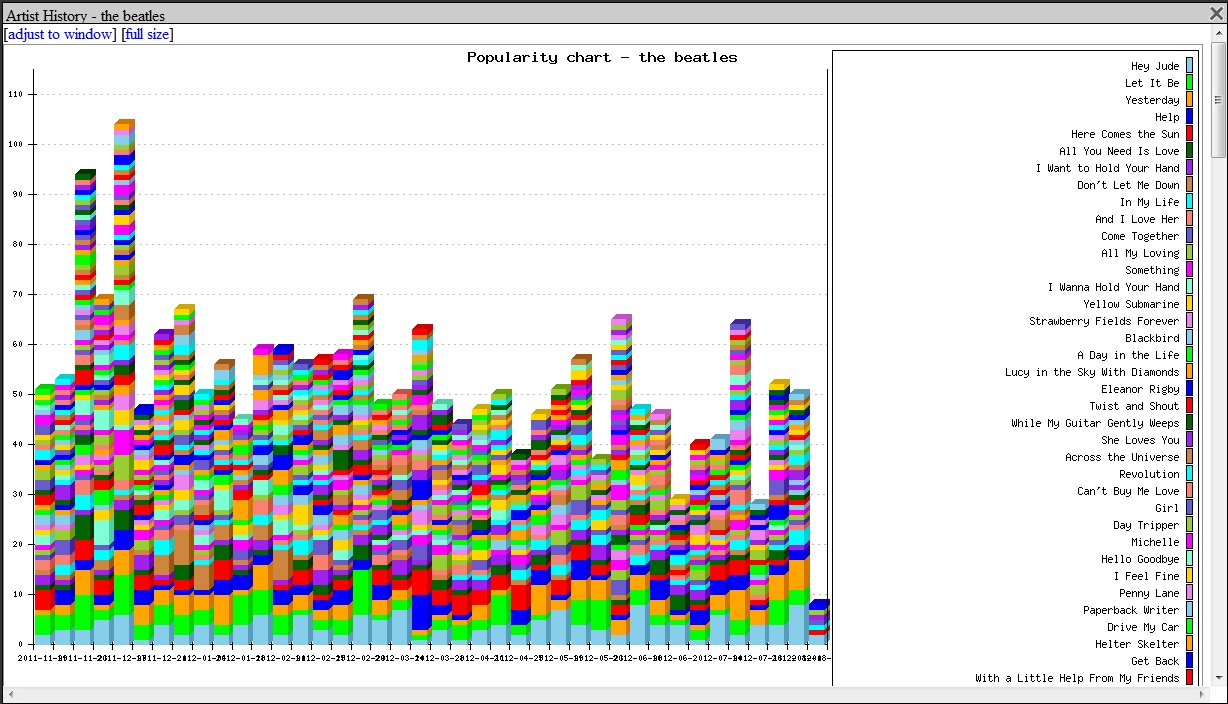
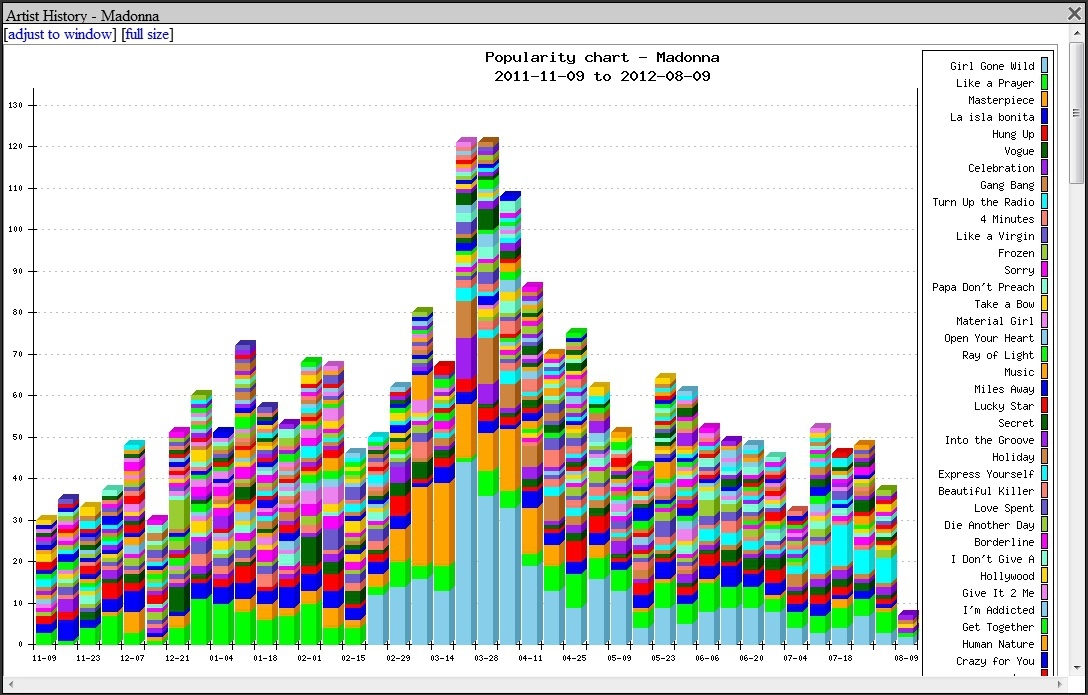
Another possibility is the evaluation of artists
on track level. Taking the Beatles as an example we see that their populartity
stays consistent over time (except for the peak in November 2011 when iTunes
decided to provide their songs on the iTunes store). For active artists (Madonna
in the current example) we see two peaks matching the release and the pre-release
date of her new album; with a special focus on these new songs.
Last, but not least it is not only possible to display statistics, but
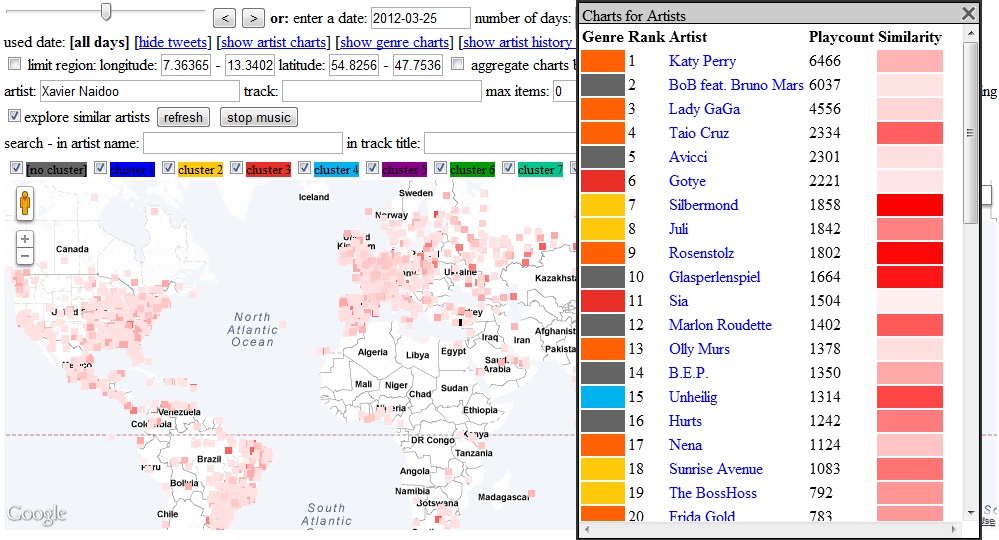
also to calculate similar artists based on co-occurrences of a given seed artist.
Following the assumption that if artists A and B are similar then fans listening
to artist A are also more likely to listen to artist B, the system calculates
the similarity of artists without referring to external sources.
Within the visualization, the seed artist is displayed in black and the 50 most
similar artists are displayed in shades of red, ranging from strong red (most similar)
to white (least similar). This colour encoding is also displayed in the charts.
In the given example, Xavier Naidoo has been used as the seed artist and
Silbermond, Rosenstolz and Glasperlenspiel are listed among the most similar
other artists.
References
Hauger, D. and Schedl, M. (2012).
Exploring
Geospatial Music Listening Patterns in Microblog Data. In
Proceedings of the 10th
International Workshop on Adaptive Multimedia Retrieval (AMR 2012),
Copenhagen, Denmark.

