It is licensed under the GNU General Public License (GPL) and can be redistributed and modified under the terms of the GPL, version 2 or later.
CoMIRVA: Collection of Music Information Retrieval and Visualization Applications
What it is
The CoMIRVA project aims at building a framework for Java-implementations of various algorithms concerning music, multimedia, information retrieval, information visualization, and data mining. At the moment, only a rather preliminary version of CoMIRVA is available. We want to include more algorithms for extracting features from audio data, from the Internet, or from other sources. Furthermore, it is planned to provide various functions for processing these data. The current implementation of CoMIRVA mainly focuses on feature extraction, data handling and visualization.
CoMIRVA is developed and maintained by
Markus Schedl
- ![]()
It is licensed under the GNU
General Public License (GPL) and can be
redistributed and modified under the terms of the GPL, version 2 or
later.
Downloads
Functionality
The current version provides the following features:
Functions available via GUI:
File - I/O
Data Processing
Audio Processing
Data Mining
Visualization
Functions available only via Classes:
| Class | Functionality |
|---|---|
| comirva.web.crawling.agmis.ExaleadRetriever | Querying the exalead
search engine and stores results lists of URLs (please respect
exalead's policy!) |
| comirva.web.crawling.agmis.CrawlListCreator | Creating a crawl list as input for the GoldenRetriever |
| comirva.web.crawling.agmis.GoldenRetriever | Load-balanced Fetcher |
| comirva.web.ie.bandmembers | Classes to extract band members from crawled Web content |
| comirva.web.ie.countryoforigin | Implementations of different approches to detecting the country of origin |
| comirva.web.retrieval.AMG_Retriever | Provides some information extractors for allmusic.com |
| comirva.web.retrieval.LastFM_ArtistInfoRetriever | Extracting playcounts and number of listeners using last.fm's Web API |
| comirva.web.retrieval.YahooDirectory_Retriever | Extracting tracks for an artist from Yahoo! Music |
| comirva.web.retrieval.Twitter_Retriever | Extracting posts from Twitter as JSON files |
| comirva.web.retrieval.Twitter_PostAnalyzer | Extract posts as plain text from Twitter JSON files |
| comirva.web.retrieval.Twitter_Indexer | Creates a lucene index from the Twitter posts |
| comirva.web.indexing.HTMLIndexer | Creates a lucene index from HTML files |
| comirva.web.indexing.TermWeighting_Lucene | Applies different term weighting measuren on a lucene index. |
| comirva.web.indexing.SimMeasure_Lucene | Calculates similarites based on term weighting vectors |
Related Publications
Investigating the Similarity Space of Music
Artists on the Micro-Blogosphere
Schedl, M., Knees, P., and Böck, S.
Proceedings of the 12th International Society for Music Information
Retrieval Conference (ISMIR 2011), Miami, FL, USA, October 2011.
>> PDF, BibTeX
The CoMIRVA Toolkit for Visualizing
Music-Related Data
Schedl, M. (2006)
Technical Report, June 2006.
>> PDF,
BibTeX
Interactive Poster: Using CoMIRVA for
Visualizing Similarities Between Music Artists
Schedl, M., Knees, P., and Widmer, G. (2005)
Proceedings of the IEEE Visualization 2005 (Vis'05), Minneapolis,
Minnesota, October 2005.
>> PDF,
BibTeX
Screenshots (click on images to enlarge)
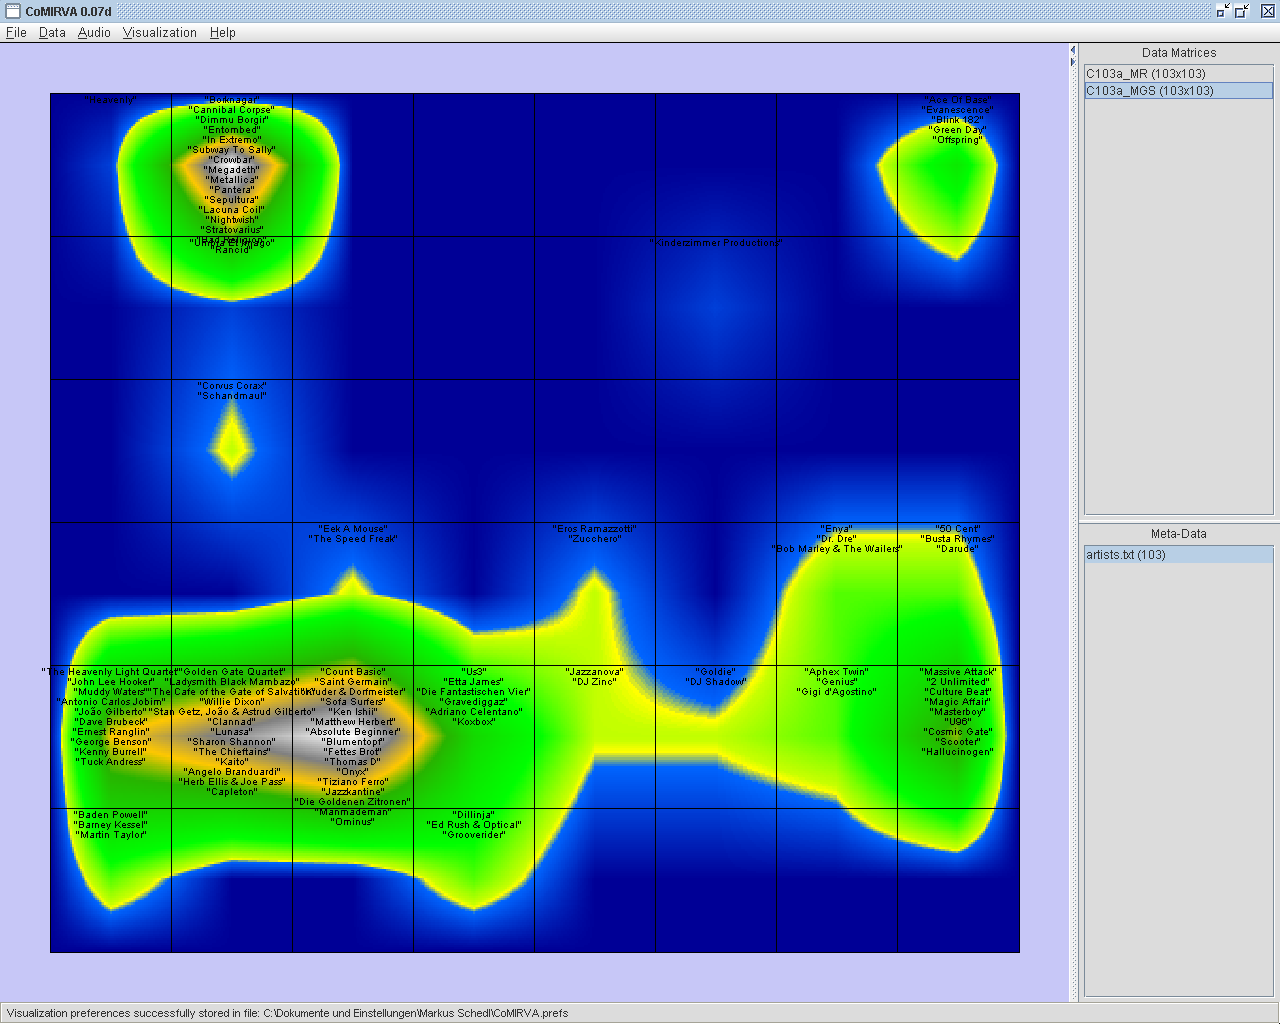 |
An SDH-visualization of a SOM trained on a similarity matrix of music artists. Co-occurrences of artist names on web pages were used to calculate the similarity matrix. The visualization uses the colormap "Islands". The upper left regions contain mainly artists that create quite aggressive music. In the lower right, a peninsula with electronic music can be found. The other artists are mostly mapped to the big islands in the lower left. |
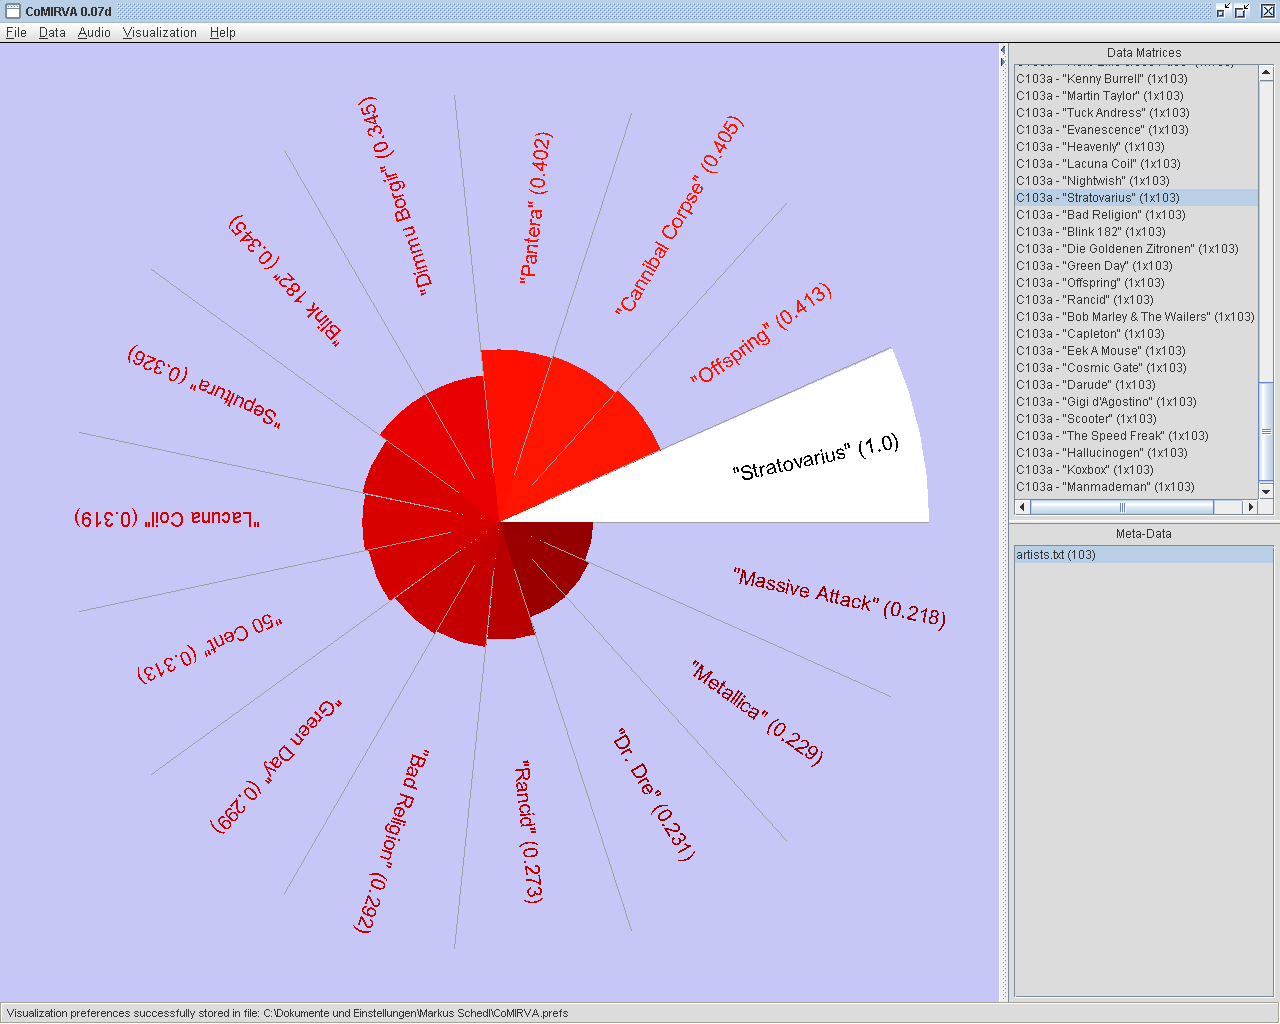 |
A "Circled
Bars"-visualization
based on the
similarity vector of the artist "Stratovarius". This visualization
arranges all artists (or whatever data is used) in a circle. The
similarity values are visualized by filled arcs that vary in length and
color. In this example, the colormap "Fire" is used. It can be seen
that "Stratovarius" often co-occurs with "Offspring" (41%), "Cannibal
Corpse" (41%), and "Pantera" (40%) on the same web page.
|
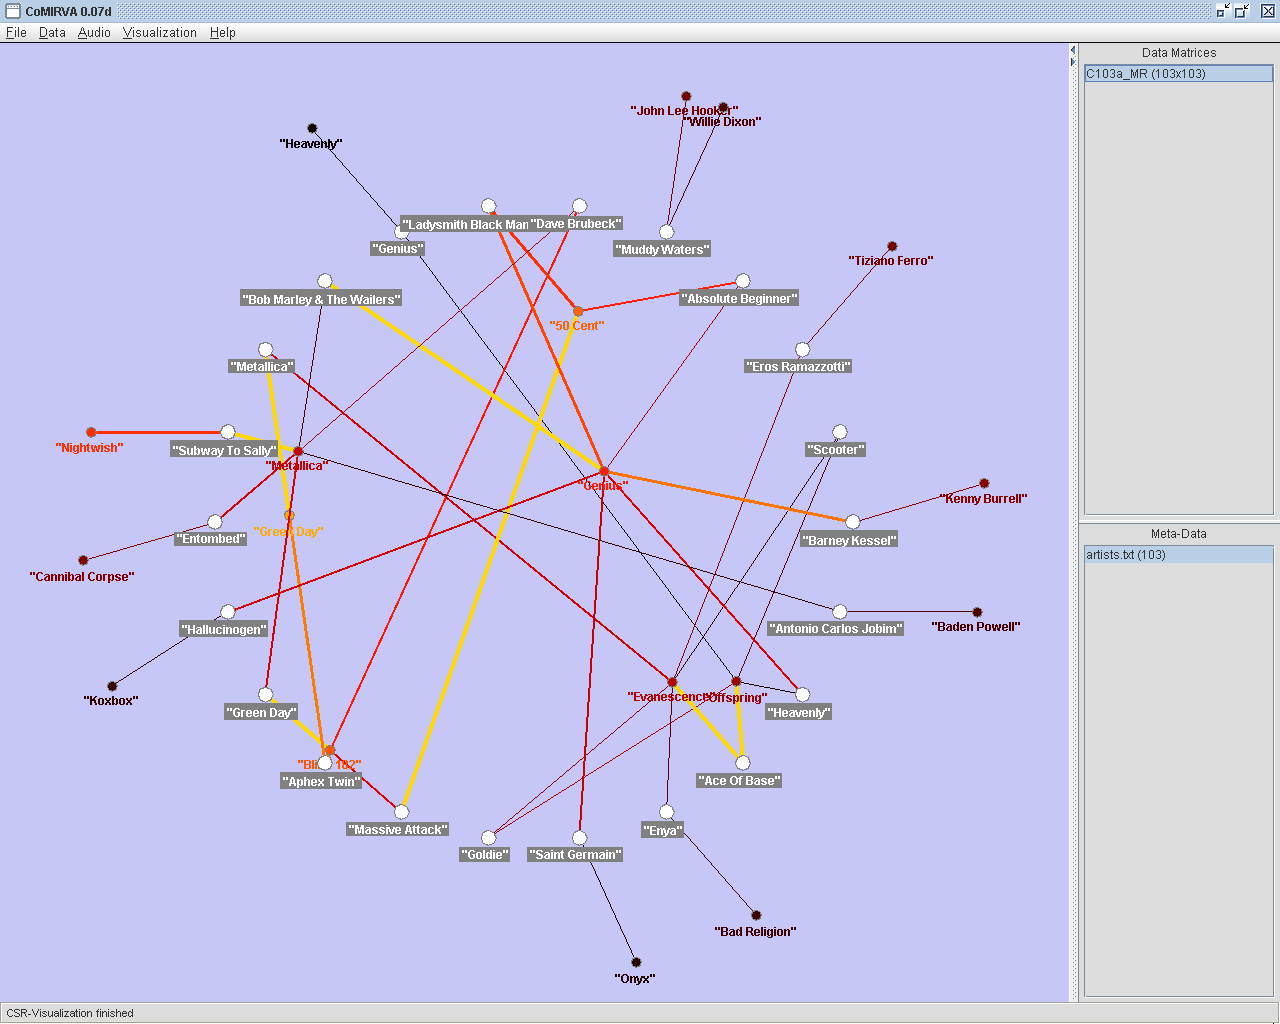
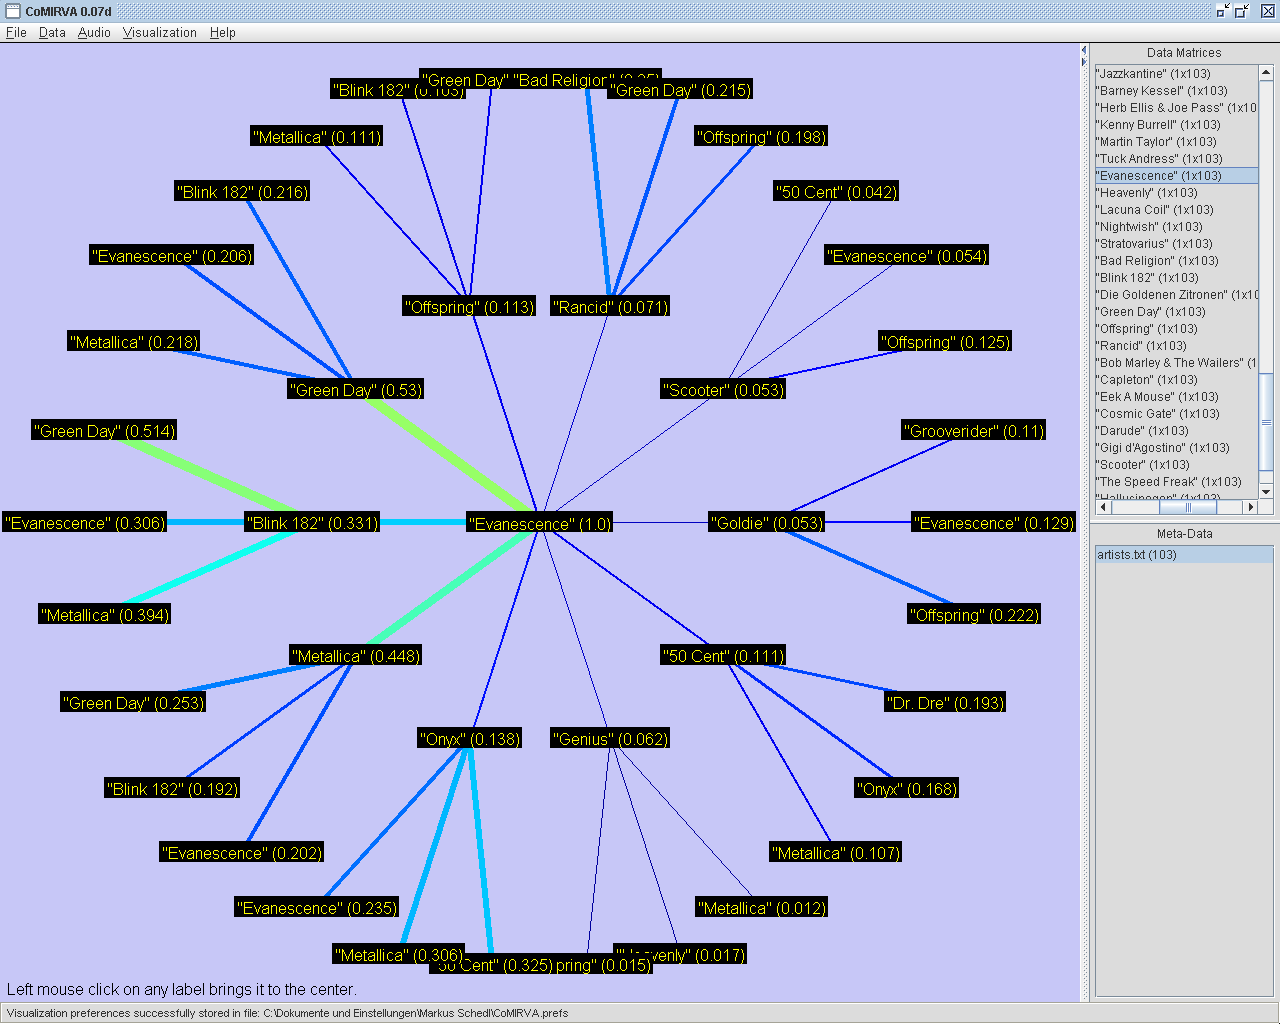 |
A "Circled
Fans"-visualization
based on a
similarity matrix of music artists. Here, the center artist
"Evanescence" is surrounded by the most similar artists which are
connected to the center artist via lines of different thickness and
color (in this case, colormap "Colorful" is used) according to the
similarity values. This neighboring artists are again connected with
their most similar artists situated on the outer circle. The user may
click on any label to create a new view with the selected artist in the
center position.
The "Circled Fans"-visualization provides a method to visualize asymmetric similarity matrices. In this example, it can be seen that "Green Day" is mentioned on 53% of the web pages containing "Evanescence", whereas "Evanescence" can only be found on 21% of the web pages that mention "Green Day". |
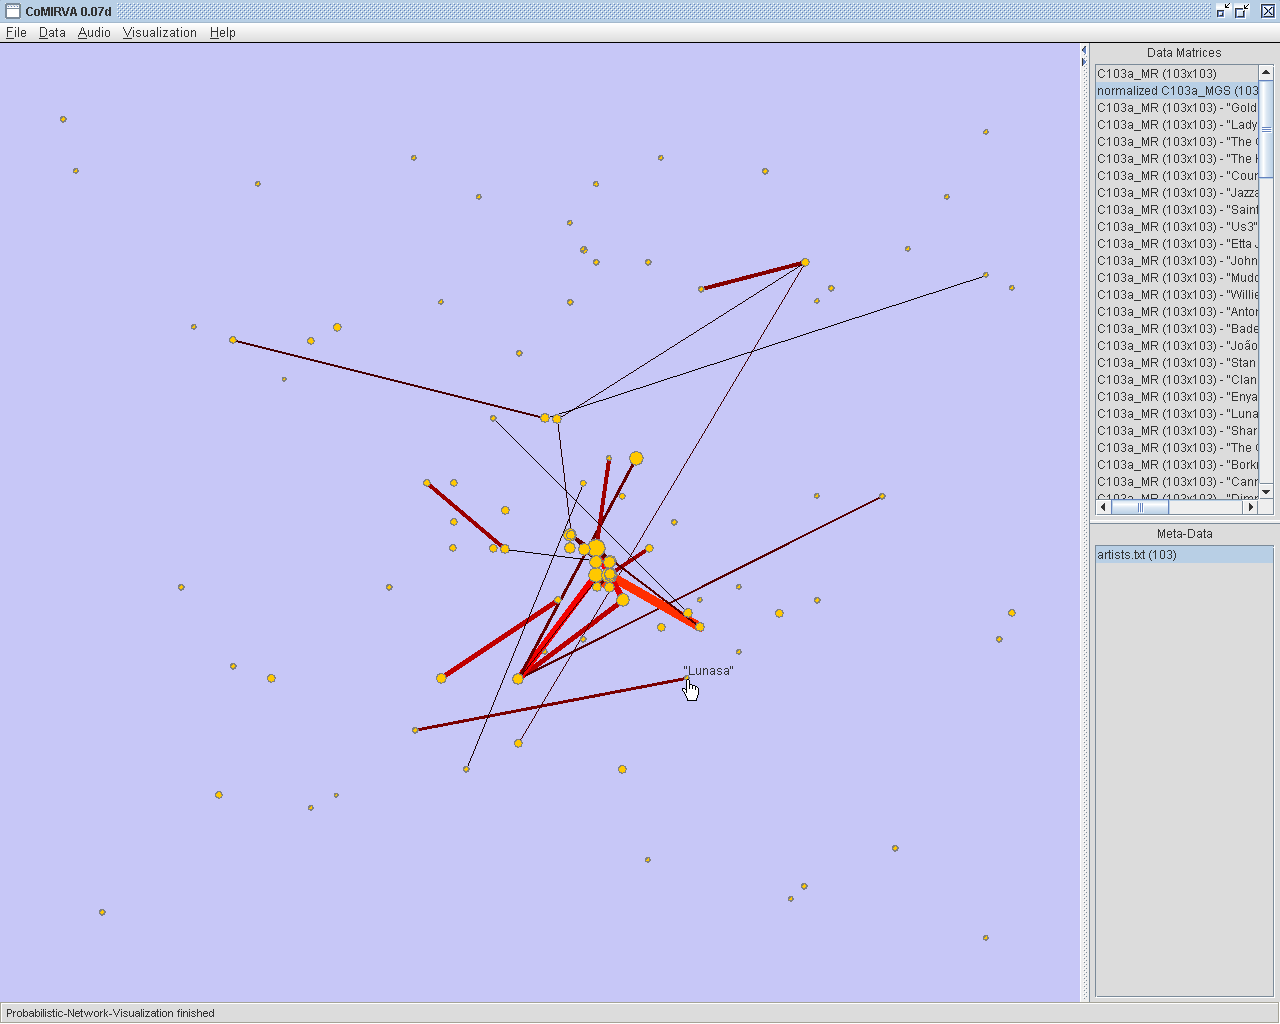 |
A "Probabilistic
Network"-visualization based on a similarity
matrix of music artists. Using this method, first, the vertices
representing the data items are
placed randomly on the screen. Then, an adaptation process that moves
similar data items closer to each other is performed iteratively.
Finally, edges between data items are drawn with a probability that is
proportional to their similarity. The size of each vertex is calculated
using the summed similarites between the data item represented by the
vertex and all other data items. The label of a vertex is displayed
when the mouse is moved over it. |
 |
A "Continuous
Similarity
Ring"-visualization based on
prototypical artists of 22 genres. This visualization approach arranges
prototypes for each genre (or any other taxonomy) in a circle using a
TSP-algorithm on the distance matrix. Then, for each prototype, a fixed
number of most similar neighbors is chosen from the complete data set.
Those neighbors which have to be connected to only one prototype are
displayed outside of the circle of prototypes. Those which neighbor
several prototypes are placed inside of the circle of prototypes and
are positioned w.r.t. their original distances. To this end, a
heuristic cost-minimizing algorithm is used, where the costs are
influenced by the difference between the distances on the screen and
the distances taken from the similarity matrix and by the total edge
length on the screen. This heuristic tries to preserve the original
distances while at the same time minimize the length of the connecting
edges. In this example, a collection of 103 music artists from 22 genres was used. The colormap "Fire" was applied to visualize the differences in similarity. |
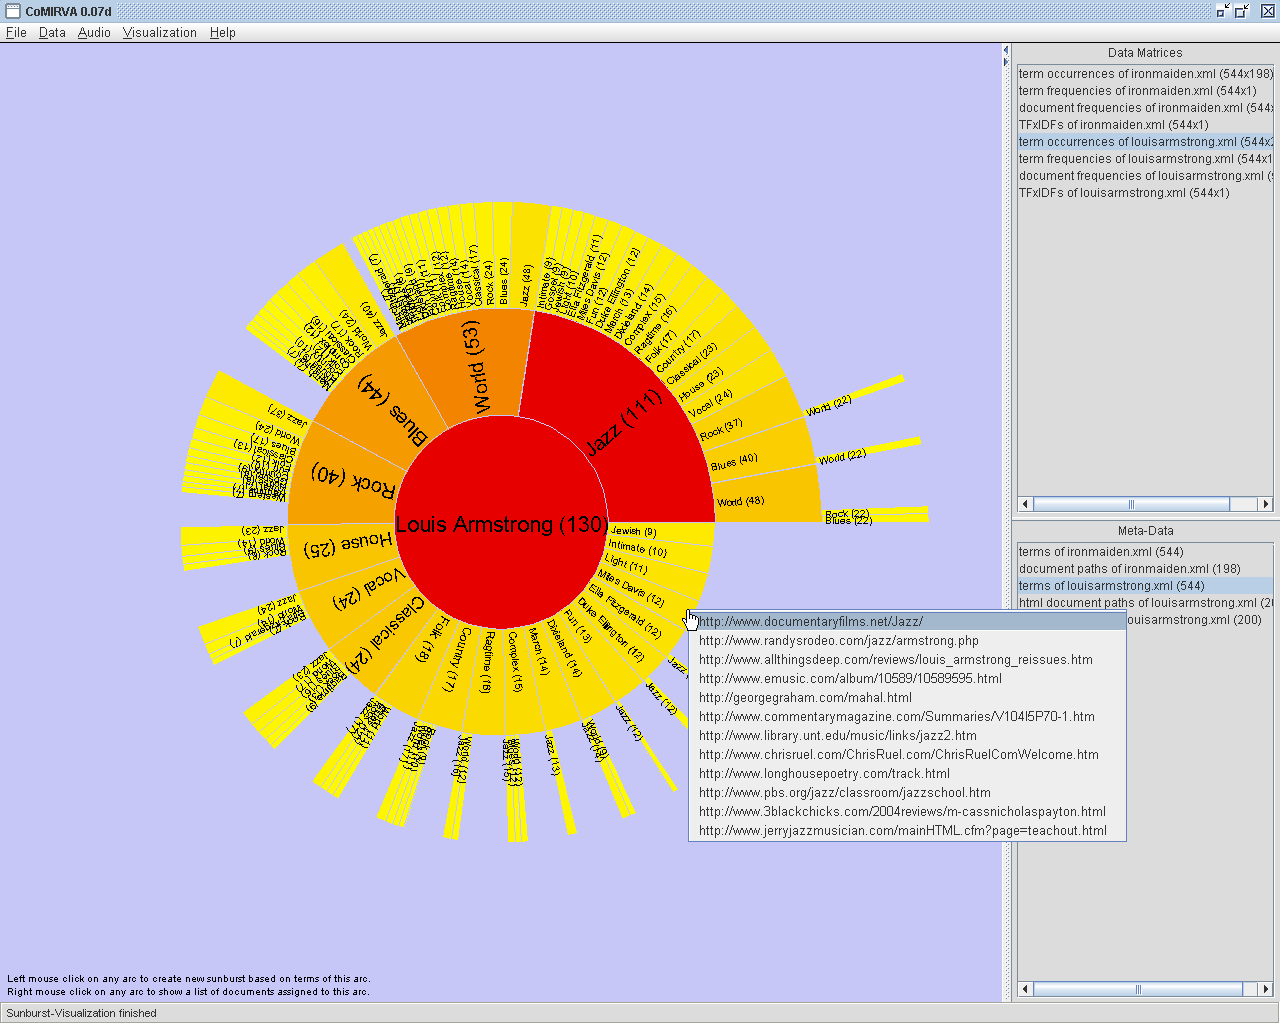 |
A
"Sunburst"-visualization based
on an "Entity Term Profile" (ETP) which was created on 130 documents
related to the artist "Louis Armstrong". For this example, the colormap
"Sun" was applied. The data for the "Sunburst" was obtained using term
co-occurrence analysis on the ETP. Thus, on every level
(torus),the terms that most often co-occur with the terms at
higher
(innermore) levels are represented as arcs. The size of each arc is
proportional to the document frequency of the respective term which is
shown in brackets. A left click with the mouse on any arc calculates a
new "Sunburst"
based only on the documents that are represented by the selected arc. A
right click with the mouse on any arc brings up a list of documents
that contain all terms which are represented by the arc (on the
screenshot, web pages containing the terms "Louis Armstrong" and "Miles
Davis"). |
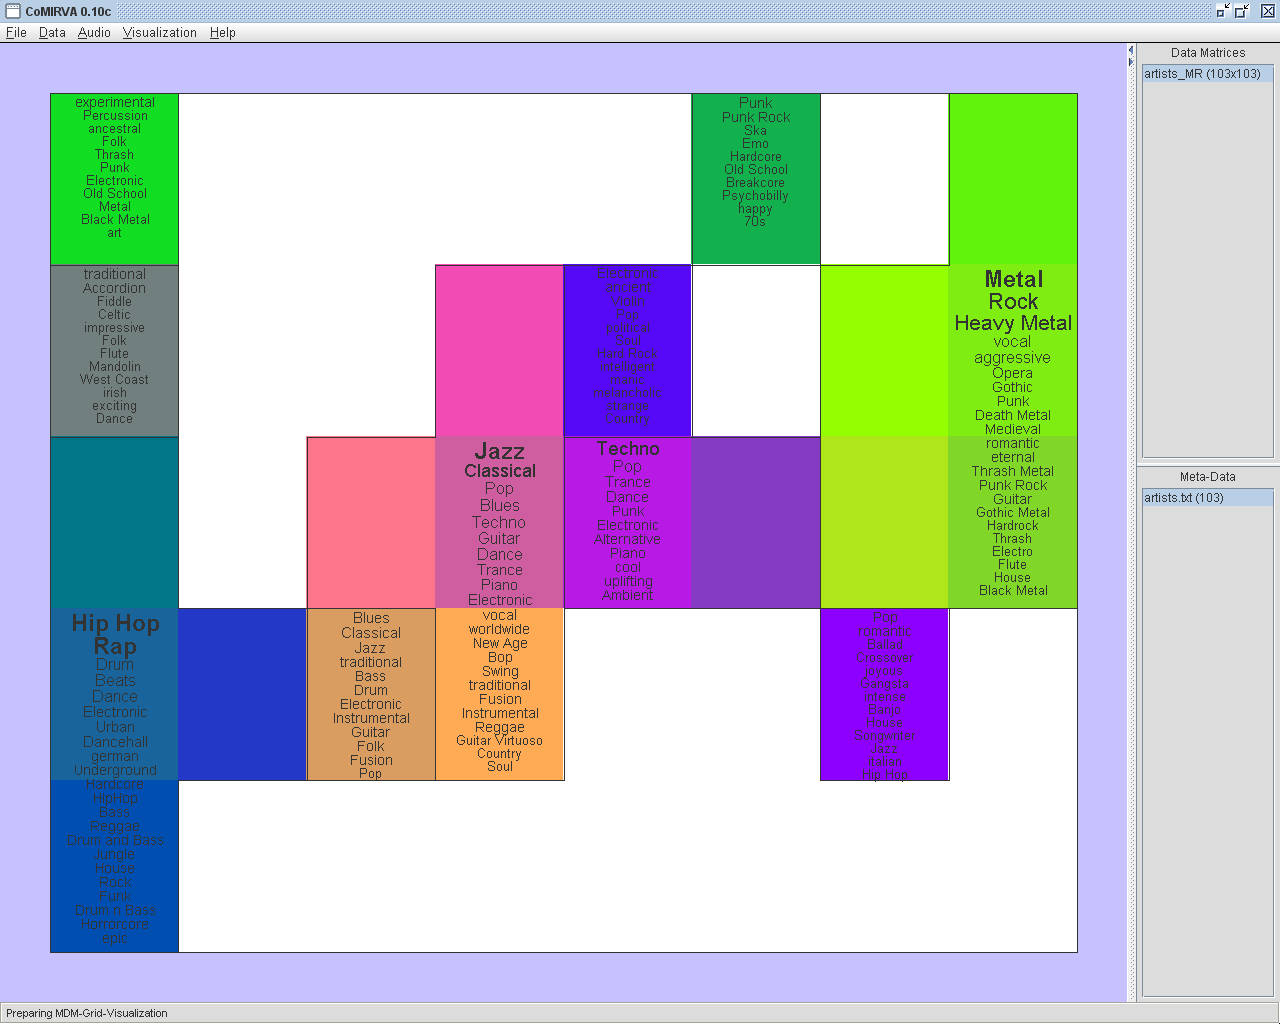 |
A "Music
Description Map"-visualization
based on a SOM trained on web data of music artists. The SOM is
automatically
subdivided according to musically relevant terms that occur on the
artists' web
pages. Furthermore, the terms are weighted using the Lagus and Kaski
SOM labeling strategy
and their sizes are adjusted according to this weighting. |